The Fibonacci retracement tool is a popular indicator used by thousands of traders in the stock markets, forex, and cryptocurrency markets. Fascinatingly, it’s based on the Fibonacci sequence discovered more than 700 years ago.
This article will go through what the Fibonacci retracement tool is and how you can use it to find important levels on a chart.
What is Fibonacci retracement?
Fibonacci retracement (or Fib retracement) is a tool used by technical analysts and traders in an attempt to predict areas of interest on a chart. They do so by using Fibonacci ratios as percentages. The Fib retracement tool is derived from a string of numbers identified by mathematician Leonardo Fibonacci in the 13th century. This string is called the Fibonacci sequence. Certain mathematical relationships between numbers in this sequence create ratios that are then plotted to a chart. These ratios are:
- 0%
- 23.6%
- 38.2%
- 61.8%
- 78.6%
- 100%
While technically not a Fibonacci ratio, some traders also consider the 50% level to have some significance, as it represents the midpoint of the price range. Fibonacci ratios outside of the 0-100% range may also be used, such as 161.8%, 261.8% or 423.6%.
How to calculate Fibonacci retracement
Let’s create a sequence of numbers that starts with zero and one, and keep adding the sum of the two preceding numbers to the current one. If we continue this indefinitely, we get a number string that’s called the Fibonacci sequence.
0, 1, 1, 2, 3, 5, 8, 13, 21, 34, 55, 89, 144, 233, 377, 610, 987... and so on.
These numbers, of course, aren’t directly plotted to a price chart. But the levels used in the Fibonacci retracement tool are all derived from these numbers in some way.
Excluding the first few numbers, if you divide a number by the number that follows it, you’ll always get a ratio close to 0.618. For example, if you divide 21 by 34, you’ll get 0.6176. And if you divide a number by the number found two places to the right, you’ll get a ratio close to 0.382. For instance, if you divide 21 by 55, you’ll get 0.3818. All the ratios (except 50%) in the Fibonacci retracement tool are based on some calculations involving this method.
The Fibonacci sequence and the Golden Ratio
As mentioned, the Fibonacci sequence was identified by mathematician Leonardo Fibonacci in the 13th century. The Golden Ratio (0.618% or 1.618%) is a mathematical ratio that is derived from these numbers. But why is it such an important number?
The Golden Ratio describes the proportions of an astoundingly long list of phenomena in the universe and can be found everywhere in nature. Think of atoms, stars, galaxy formations, shells, even honeybees – everything from the smallest to largest scale may have examples of this proportion.
What’s more, it’s been used by artists, engineers, and designers for centuries to create aesthetically pleasing compositions. From the pyramids to the Mona Lisa and the Twitter logo, many famous works of art and design use the Golden Ratio in some way. As it turns out, this ratio might also have significance in the financial markets as well.
How to use Fibonacci retracement
Now that we know what the Fibonacci retracement tool is and how it works, let’s consider its use as a tool in the financial markets.
Typically, the tool is drawn between two significant price points, such as a high and a low. This range is then used as a basis for further analysis. Usually, the tool is used for mapping out levels inside of the range, but it may also provide insights into important price levels outside of the range.
What Fibonacci levels tell traders
Traders may use Fibonacci levels to determine potential entry areas, price targets, or stop-loss points. This can vary significantly on the individual setup, strategy, and trading style.
Some strategies involve profiting on the range between two specific Fibonacci levels. For example, consider an uptrend followed by a retracement. Buying at the 38.2% retracement level then selling at the 23.6% level could be an interesting strategy. This is, of course, highly dependent on individual strategy and many other technical factors.
Fibonacci extensions
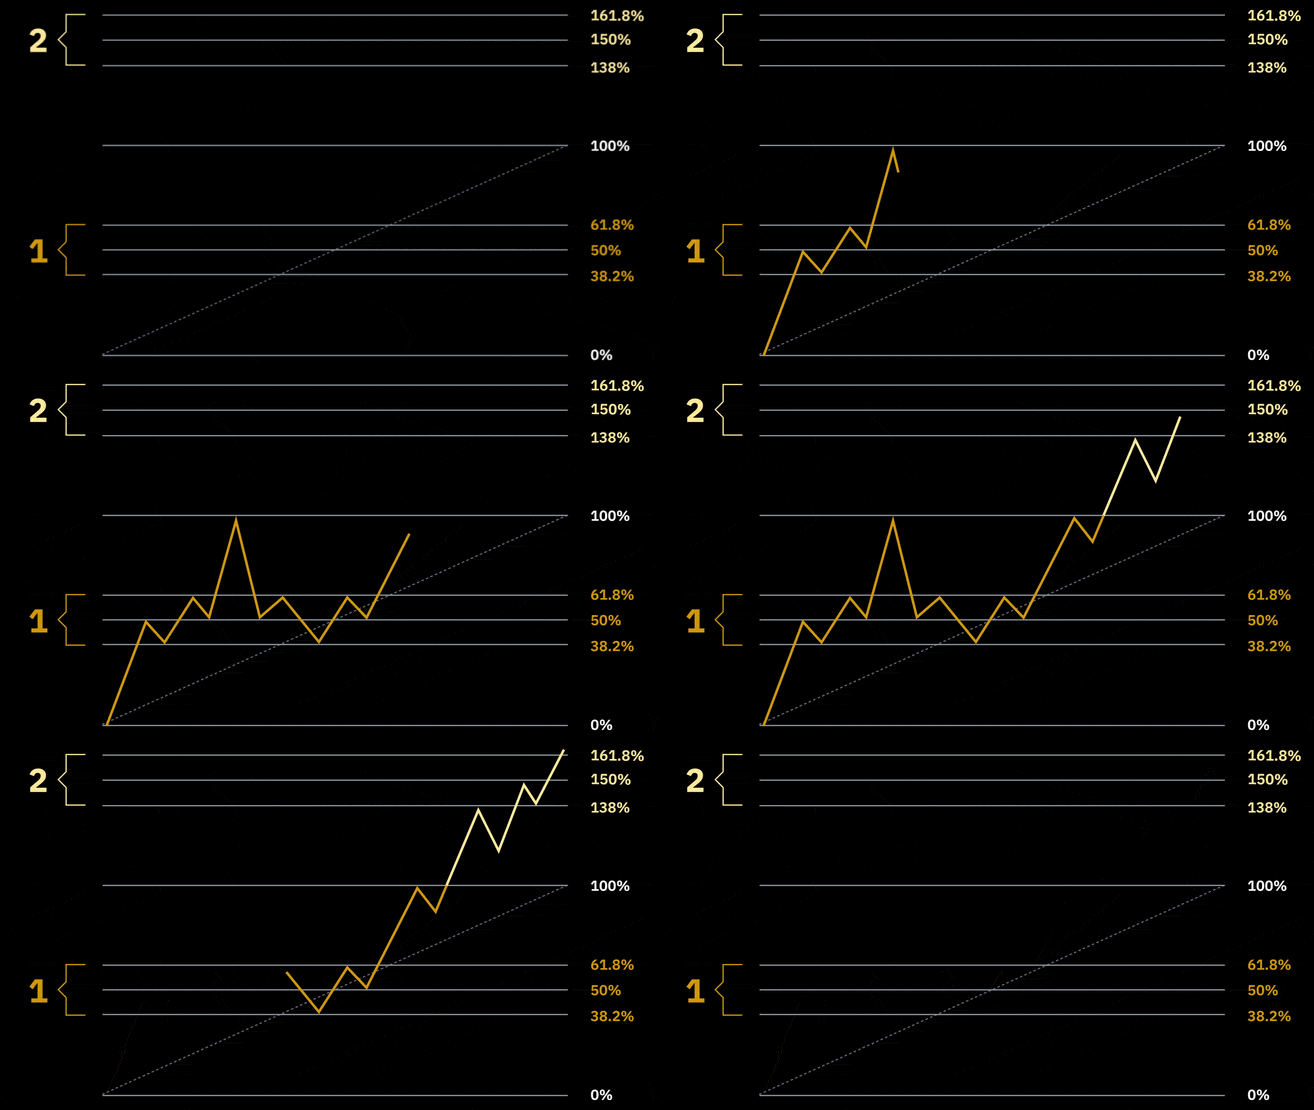
As mentioned, the Fibonacci levels can be used for evaluating retracement or bounce areas (number 1 in the animation below). But in addition to that, the Fibonacci sequence can also be used as a way to gauge potentially important levels outside of the current range. These are called extension levels (see number 2).
Fibonacci extension levels may be seen as potential trading targets. Each trader may choose a different extension level as a target (or multiple targets). The first extension levels are 138.6%, 150%, and 161.8% – followed by 261.8% and 423.6%. So, Fibonacci extension levels may indicate areas where the next price moves might end up.
Closing thoughts
Fibonacci numbers are found everywhere in nature, and many traders believe that they have relevance when charting financial markets.
This article does not contain investment advice or recommendations. Every investment and trading move involves risk, and readers should conduct their own research when making a decision.


